Length : around 5 minutes
Time's up
#############
Quiz-summary
0 of 5 questions completed
Questions:
- 1
- 2
- 3
- 4
- 5
Information
Based on the optimization exercise seen in the previous lesson,
« A company sells chairs and small tables which it produces using a stock of 16 wood units, 10 fabric units, and employs a worker for 40 hours of labour.
1 chair requires : 1 hour of labour, 1 wood unit, 1 fabric unit
1 table requires : 4 hours of labour, 1 wood unit.
A chair costs 15€, a table costs 30€. The goal of the company is to maximize its turnover. »
We have the following linear programme :
Maximize Z = 15NC+30NT
with NC+NT ≤ 16
NC ≤ 10
NC+4NT ≤ 40
NC ≥ 0 ; NT ≥ 0
It is possible to represent the linear programme graphically, then answer the questions : Click on “Start Quiz”.
You have already completed the quiz before. Hence you can not start it again.
Quiz is loading...
You must sign in or sign up to start the quiz.
You have to finish following quiz, to start this quiz:
Results
0 of 5 questions answered correctly
Time has elapsed
Categories
- Not categorized 0%
-
To view the corrections for each question individually, click on “view questions”
- 1
- 2
- 3
- 4
- 5
- Answered
- Review
-
Question 1 of 5
1. Question
Based on the optimization exercise seen in the previous lesson,
« A company sells chairs and small tables which it produces using a stock of 16 wood units, 10 fabric units, and employs a worker for 40 hours of labour.
1 chair requires : 1 hour of labour, 1 wood unit, 1 fabric unit
1 table requires : 4 hours of labour, 1 wood unit.
A chair costs 15€, a table costs 30€. The goal of the company is to maximize its turnover. »
We have the following linear programme :
Maximize Z = 15NC+30NT
with NC+NT ≤ 16
NC ≤ 10
NC+4NT ≤ 40
NC ≥ 0 ; NT ≥ 0The graphic illustrating the linear programme is the following :
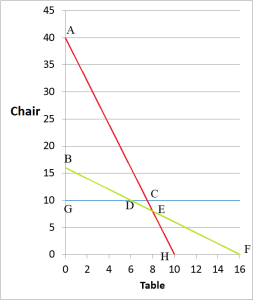
Answer the questions :
What does the green line represent ?
Correct
The wood constraint is as follows : NC + NT <= 16. Drawing a line only requires 2 points. For example, if we connect the 0 chair and 16 tables point (F) with the 16 chairs and 0 table point (B), we obtain the line NC + NT = 16.
Incorrect
The wood constraint is as follows : NC + NT <= 16. Drawing a line only requires 2 points. For example, if we connect the 0 chair and 16 tables point (F) with the 16 chairs and 0 table point (B), we obtain the line NC + NT = 16.
-
Question 2 of 5
2. Question
What does the blue line represent ?
Correct
The fabric constraint is as follows : NC <= 10. Regardless of the number of tables, the number of chairs must not be higher than 10, because a table does not require fabric. The line is therefore parallel to the Table axis at the level of 10 chairs.
Incorrect
The fabric constraint is as follows : NC <= 10. Regardless of the number of tables, the number of chairs must not be higher than 10, because a table does not require fabric. The line is therefore parallel to the Table axis at the level of 10 chairs.
-
Question 3 of 5
3. Question
What does the red line represent ?
Correct
The labour constraint is as follows : NC+ 4NT= 40. Drawing a line only requires 2 points. For example, if we connect the 0 chair and 10 tables point (H) and the 40 chairs and 0 table point (A), we obtain the line NC+ 4NT= 40.
Incorrect
The labour constraint is as follows : NC+ 4NT= 40. Drawing a line only requires 2 points. For example, if we connect the 0 chair and 10 tables point (H) and the 40 chairs and 0 table point (A), we obtain the line NC+ 4NT= 40.
-
Question 4 of 5
4. Question
Where is the feasible region ? (Write the letters is lower case without spaces)
Correct
Incorrect
False, the feasible region is OGDEH.
Firstly, the number of tables and chairs must be positive or equal to zero, which identifies a feasible region to the top right of the 0 point. We then know that constraints are inequations, which are graphically represented by a line which defines a region above or below it, according to the sign of the inequation. In our case, we are dealing with available quantity therefore each line defines the upper part of the area.
Finally, the feasible region is the region below all the lines for all the constraints must be complied with simultaneously. For example this is not the case for the BDG region, which is above the blue line : the fabric constraint is not being complied with. -
Question 5 of 5
5. Question
We have added iso-income lines which represent the goal functions and pass through various points of the graph. According to you, what is the solution to the model ?
Correct
The solution is in point E. Indeed, the further away from the origin the iso-income lines go, the higher the income becomes. But the iso-income line must also be tangent to the feasible region. The solution is therefore the point of the feasible region that is tangent to the iso-income line which is the furthest from the origin.
Incorrect
The solution is in point E. Indeed, the further away from the origin the iso-income lines go, the higher the income becomes. But the iso-income line must also be tangent to the feasible region. The solution is therefore the point of the feasible region that is tangent to the iso-income line which is the furthest from the origin.